
Chapter 4 - Introduction to technical indicators
Lesson 4.6 - Moving Average (MA)

Moving averages are trend indicators that can be used to determine the presence and direction of a trend. It is one of the most versatile tools that can be applied to price charts and widely used as part of mechanical trading systems. Moving average (MA) conveys the erroneous nature of price movement by calculating average price data over a specified period. This could be the average closing price, opening price, highest or lowest.
Thus, the 5-day moving average of the closing price is the average closing price during the past five days. Since the data moving average is the previous data average, they are lagging indicators that follow the price movement. Thus, moving averages determine trends only after they are created. Moreover, the longer the moving average period is, the more smooth and less sensitive it is to price changes than the shorter moving average period, but it has a greater lag period.
How is the moving average indicator added to the chart in the MetaTrader 4 platform?
If the interface of the platform is in English, you need to follow these steps:
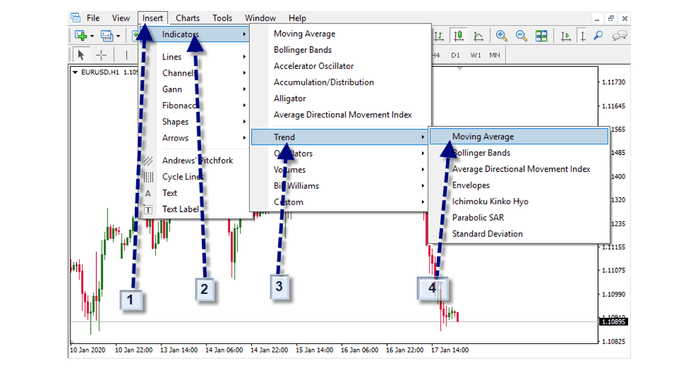
1- Click on the “insert” tab .
2- Click on the indicators
3- Click on the word "Trend"
4- Press the word “Moving Average”
After clicking on the word “Moving Average” and choosing the desired indicator, the following interface will appear to us:
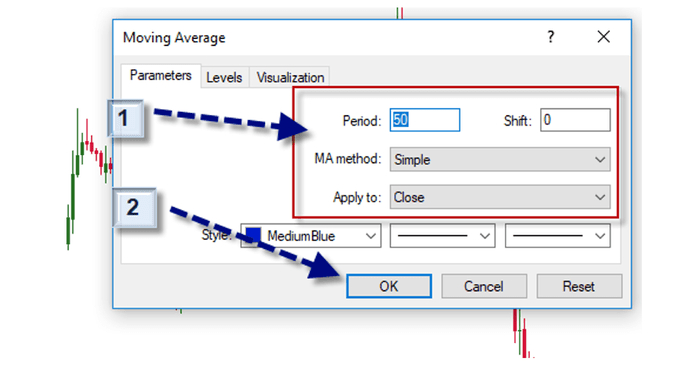
1- The indicator settings are adjusted according to the technical analyst desire, or the default settings are kept.
2- Click “Ok” after choosing the required settings.
Moving Averages Types
There are three common types of moving averages: Simple Moving Average (SMA); Exponential Moving Average (EMA), Smooth Moving Average (SMMA), and Linearly Weighted Moving Average (LWMA). There are also less common moving averages, such as Triple Moving Average (TMA), Variable Moving Average (VMA) and Volume-adjusted Moving Average (VAMA).
Simple Moving Average
Simple Moving Average (SMA) is simply the average price data for the period under analysis with no additional weight for any of the data. Thus, the 5-day moving average is calculated simply by calculating the sum of the price for the past five days and dividing the result by 5, using the following formula:
SMA n = ( price1 + price2 + ... + price n ) / n
Where (n) is the SMA period as defined by the trader.
The Simple Moving Average (SMA) has two weaknesses that can make it somewhat irregular.
First, the Simple Moving Average (SMA) is sensitive to the price being dropped when calculating the new SMA. If the dropped price is much higher than the average, this may cause the SMA to drop significantly, and if the dropped price is much lower than the average, this may cause the SMA to increase significantly.
Second, the Simple Moving Average (SMA) is sensitive to the latest price added to the calculation. If the added price is well above the average, this may cause the SMA to increase significantly, and if the added price is less than the average, it may cause the SMA to decrease significantly.
Exponential Moving Average (EMA)
Exponential Moving Average Indicator is an improvement of the Simple Moving Average (SMA), which attempts to allocate more weight to the latest data, making it less sensitive to the price dropped from the calculation, and reduces the lag. This is accomplished by applying the homogeneity constant to the simple moving average indicator (SMA) and then calculating the exponential moving average (EMA). Thus, the EMA indicator is calculated in three stages:
First, compute the SMA for the period (n).
Second, calculate the smoothing constant (Sm) using the following equation:
Sm = ( 2 / ( n + 1 ) )
Finally, calculate the EMA using the following equation:
EMA = ( price - previous EMA ) x Sm + previous EMA
Smooth Moving Average (SMMA)
The smooth moving average indicator is a combination of the SMA indicator and the EMA indicator. It gives recent prices equal weighting as historical prices, since it takes all available price data into account. This is accomplished by subtracting SMMA for the previous period from today's price and adding the result to SMMA in the previous period to find SMMA for the current period. The SMMA formula begins by calculating the SMA with the same SMMA return period and dividing it by the reversal period:
SMMA1 = SMA ( n ) / n
Where (n) is the SMMA return period. Subsequent SMMA values are calculated using the following formula:
SMMA( i ) = ( ( SMMA( i - 1 ) x n ) - SMMA ( i - 1 ) + CLOSE( i ) ) / n
Where (n) is the SMMA period, SMMA (i) is the SMMA for the current bar, and CLOSE (i) is the current closing price.
SMMA is almost the same as EMA in twice as long as the reversal period.
In other words, SMMA for 20 periods is almost identical to EMA for 40 periods.
Linearly Weighted Moving Average (LWMA)
The Linear Weighted Moving Average indicator is another SMA improvement that is also trying to assign more weight to the latest data. However, it did this by multiplying each price data by its position in the data stream with the oldest price data ranking (1) and the latest price data ranking (n), where (n) is the WMA period as defined by the trader. Then, the sum of the results is divided by adding (n), As per the following mathematical equation:
LWMAn = ( ( price1 x 1 ) + ( price2 x 2 ) + ... + ( pricen x n ) / ( n x ( n + 1 ) ) ) / 2
Triple Moving Average (TMA)
Triple Moving Average (TMA) is another improvement of the SMA indicator, trying to improve the indicator's sensitivity to price movement. Triple Moving Average (TMA) attempts to do this by applying a "double smoothing" model. First, the SMA indicator is calculated. Then, for each SMA subsequent bar, SMA is calculated. This process gives more weight to the central part of the data interval. The formula used is:
TMAn = ( SMA -1 + SMA -2 + ... + SMA -n ) / n
Where (n) is the TMA period as defined by the trader.
Unfortunately, the double smoothing does not overcome the indicator lag, and a number of traders prefer to replace the TMA to the left of the chart by half of the reverse period, and induce the "missing" data to the current bar. However, no form of induction is 100% accurate, which results in the indicator being repainted when data becomes available.
Variable Moving Average (VMA)
The Variable Moving Average (VMA) is an adaptation of EMA, developed by Tushar Chande in 1992. As shown in the Chande Momentum CMO oscillator for 9 periods, price volatility is used to adjust the smoothing constant (Sm) of the data series. When volatility is higher, the smoothing constant is higher, which gives current data more weight. Conversely, when volatility is less, the smoothing constant (Sm) is less, which gives current data less weight. This makes the VMA more sensitive during periods of volatility and less sensitive during periods of low volatility, allowing the moving average to be more reliable in both high and low volatile markets.
Volume-adjusted Moving Average (VAMA)
The Volume-adjusted Moving Average (VAMA) was developed by Richard W. Arms Jr. It sets the weight for the data based on the size of that period. Thus, a period with a larger volume will have the largest weight in determining a moving average, while a period with a lower volume will have a lower weight.
The The Volume-adjusted Moving Average (VAMA) is calculated by volume through setting the weighting first for each period using the following formula:
( price x volume ) / volume
A simple moving average is then applied to the results for each period under analysis.
Trends and Moving Averages
The slope of the moving average (MA) determines the direction of the trend. A sharper moving average indicates greater momentum behind the trends, and hence the strength of the trend. When the moving average (MA) begins to settle, this indicates a decrease in momentum. This is the first warning of a possible trend reversal.
An example of a moving average indicator (MA) on the chart
The following chart shows the general appearance of the Moving Average, as it appears on the MetaTrader 4 platform.
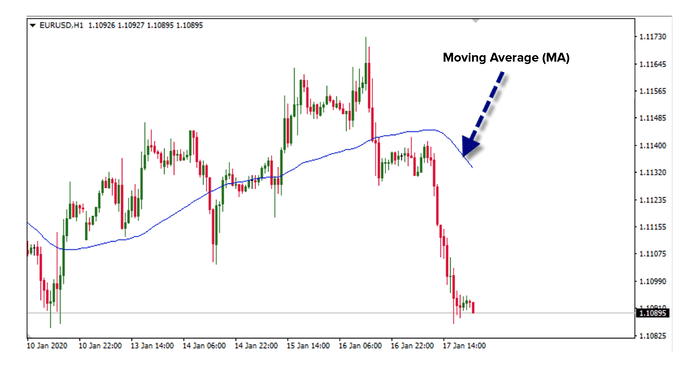
The previous chart shows the Simple Moving Average (SMA) for a period of 50 candles in the 60-minute blue chart for the EUR\ USD. The blue line represents the moving average indicator.